
Data
Understanding Sensor Data
H2NOW Chicago uses real-time probes – Proteus Probes – on each branch of the Chicago River to monitor microbial water quality. Since there currently are no direct methods to measure microbes in surface water in real-time, H2NOW has developed an innovative approach.
What the probes measure and what the data means
The static plots and explanations below will walk you through how different sensors respond to different events on the river and what that might mean for microbial water quality. We hope you will enjoy learning with us!
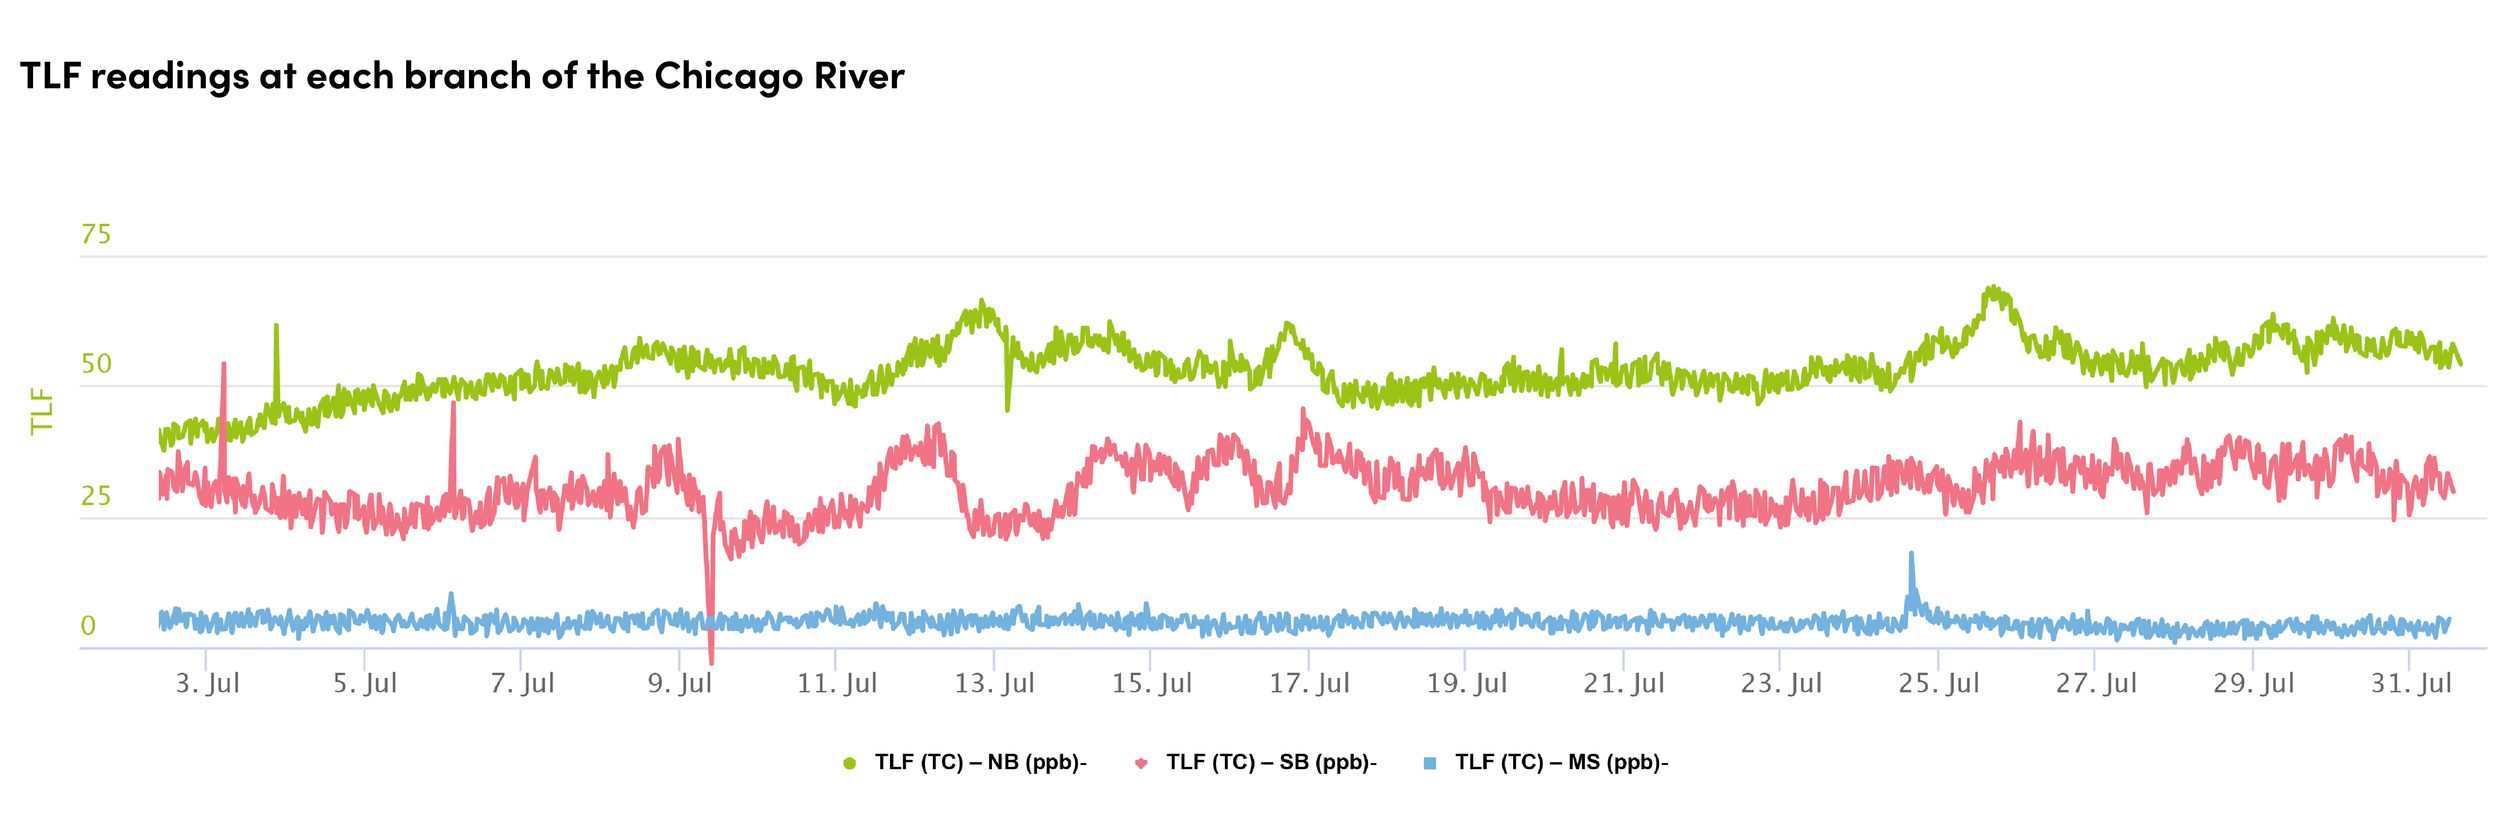
Plot 1 TLF readings at all three branches of the Chicago River (July 2021, NB - North Branch, SB - South Branch, MS - Main Stem)
TLF is measured by a novel optical sensor that has been shown to correspond to microbial concentrations in lab experiments. We have been examining its ability to estimate fecal coliform levels in a constantly changing natural system, such as the Chicago River. We found that TLF has a background level, likely due to a number of other contaminants present in the water, and this level is different in each branch of the river. Plot 1 shows TLF data from all three branches. The North Branch has the highest background TLF, and the Main Stem, the lowest. Because the South Branch combines both North Branch and Main Stem waters, its background TLF is between the two. The differing background TLF levels mean that each branch needs its own model correlating TLF and other sensor readings to fecal coliforms.
Plot 2. TLF data from the North Branch of the Chicago River (May-June 2021)
Plot 2 shows TLF data collected in 2021 at the North Branch site. The time period shown on the plot covers a range of events and weather conditions. These are explained in more detail below.
What happens during relatively dry periods
During dry weather periods, TLF may stay relatively constant or slowly creep upward or downward (circled blue on Plot 2). The upward trend may be caused by warmer temperatures that stimulate the growth of the river’s native microbial communities.
What happens after rain
During or after a significant rain event, TLF usually peaks (circled orange on Plot 2). On the North Branch, the peaks appear about 12 hours after the rain has started at about the same time water from the North Branch above its confluence with the North Shore Channel reaches the sensor site. When sampling during these peaks, we typically detect much higher fecal coliform numbers. Plot 3 shows how fecal coliform test results corresponded to TLF on the North Branch in 2021. The pink line on Plot 3 is at 200 CFU/100 mL of fecal coliform - the threshold below which river water is deemed safe for contact. Peaks during which a river sample was tested for fecal coliforms are circled black.
What happens after a sewer overflow
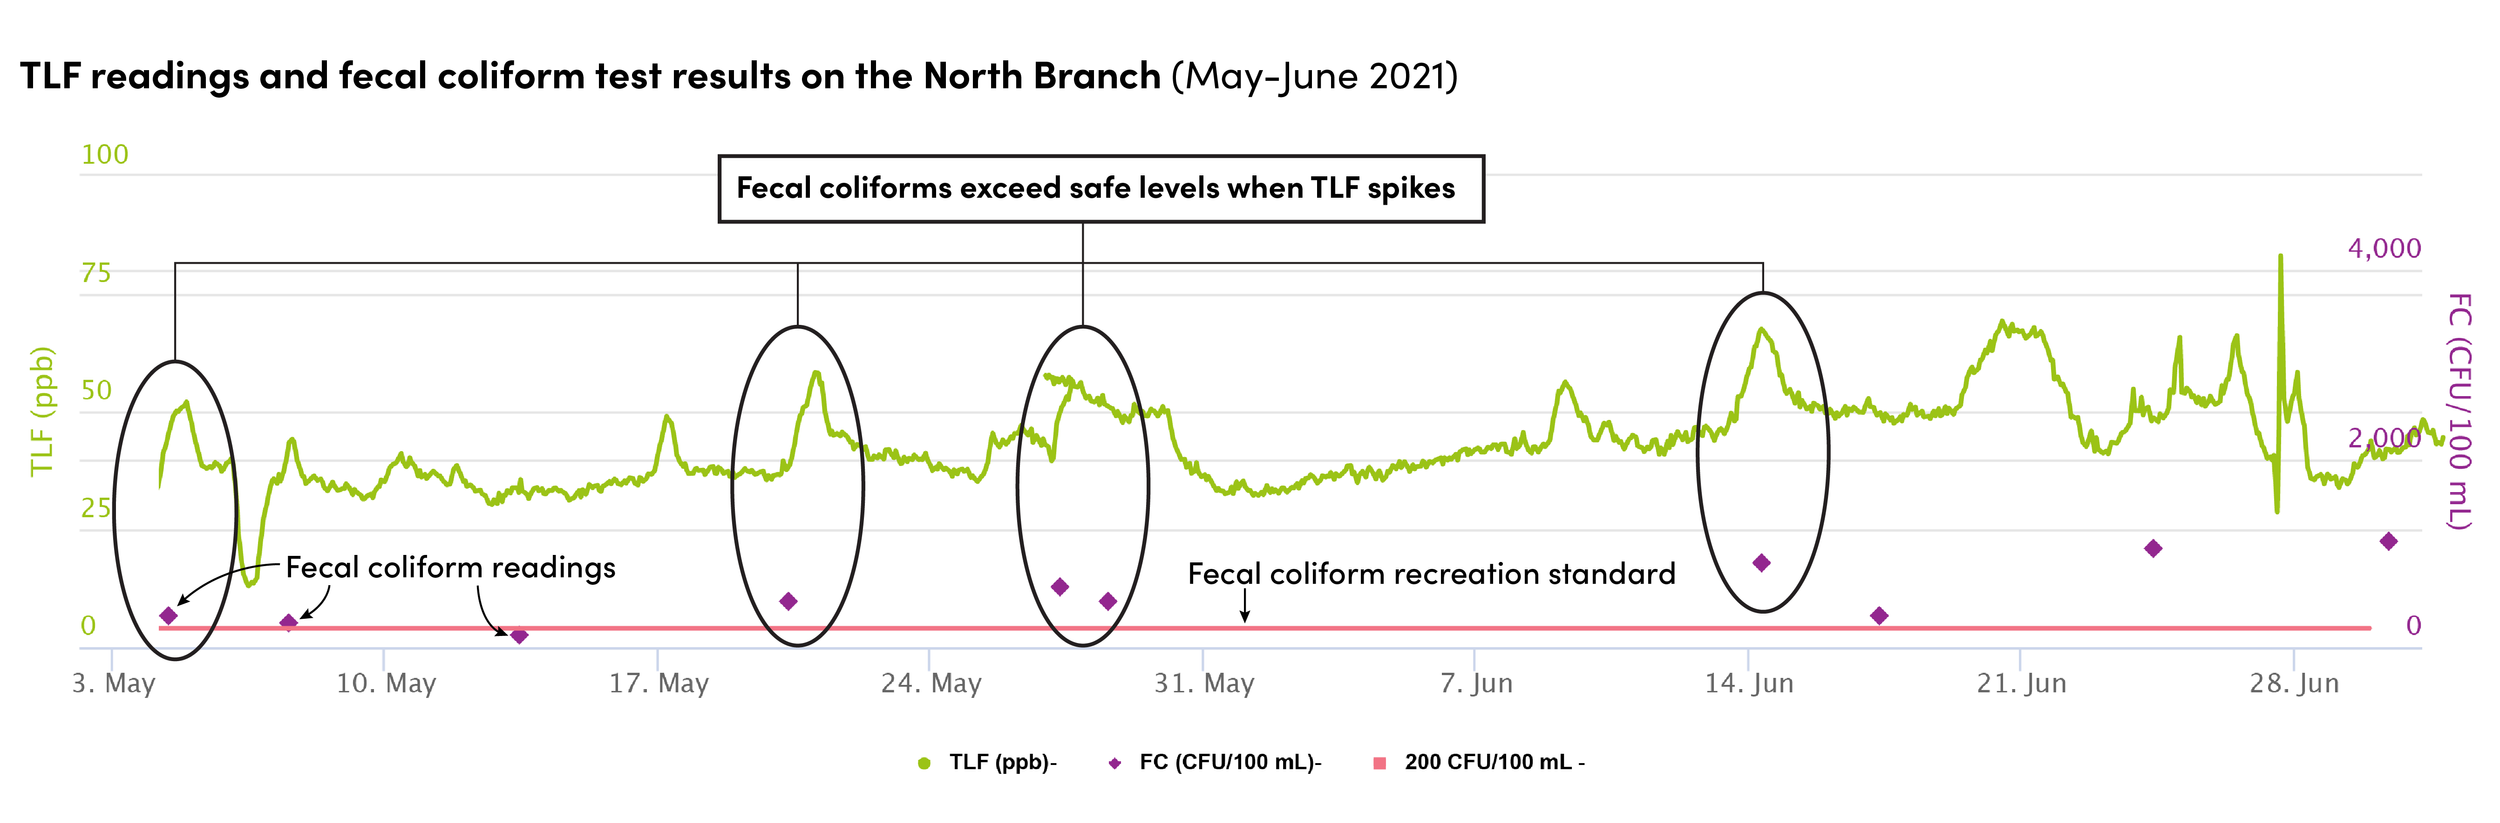
Plot 3: TLF readings and fecal coliform test results on the North Branch (May-June 2021)
When a combined sewer overflow (CSO) occurs, meaning that raw sewage spills into the river along with stormwater, we expect TLF readings to go up sharply. This is exactly what we observed on June 26, 2021, when a CSO occurred just upstream of the Proteus probe on the North Branch (circled red on Plot 2) Our tests show that fecal coliform numbers can be 40,000 CFU/100 mL or higher during these extreme events. Plot 4 demonstrates how other sensor readings change during a CSO event - not surprisingly, both turbidity and temperature also peak.
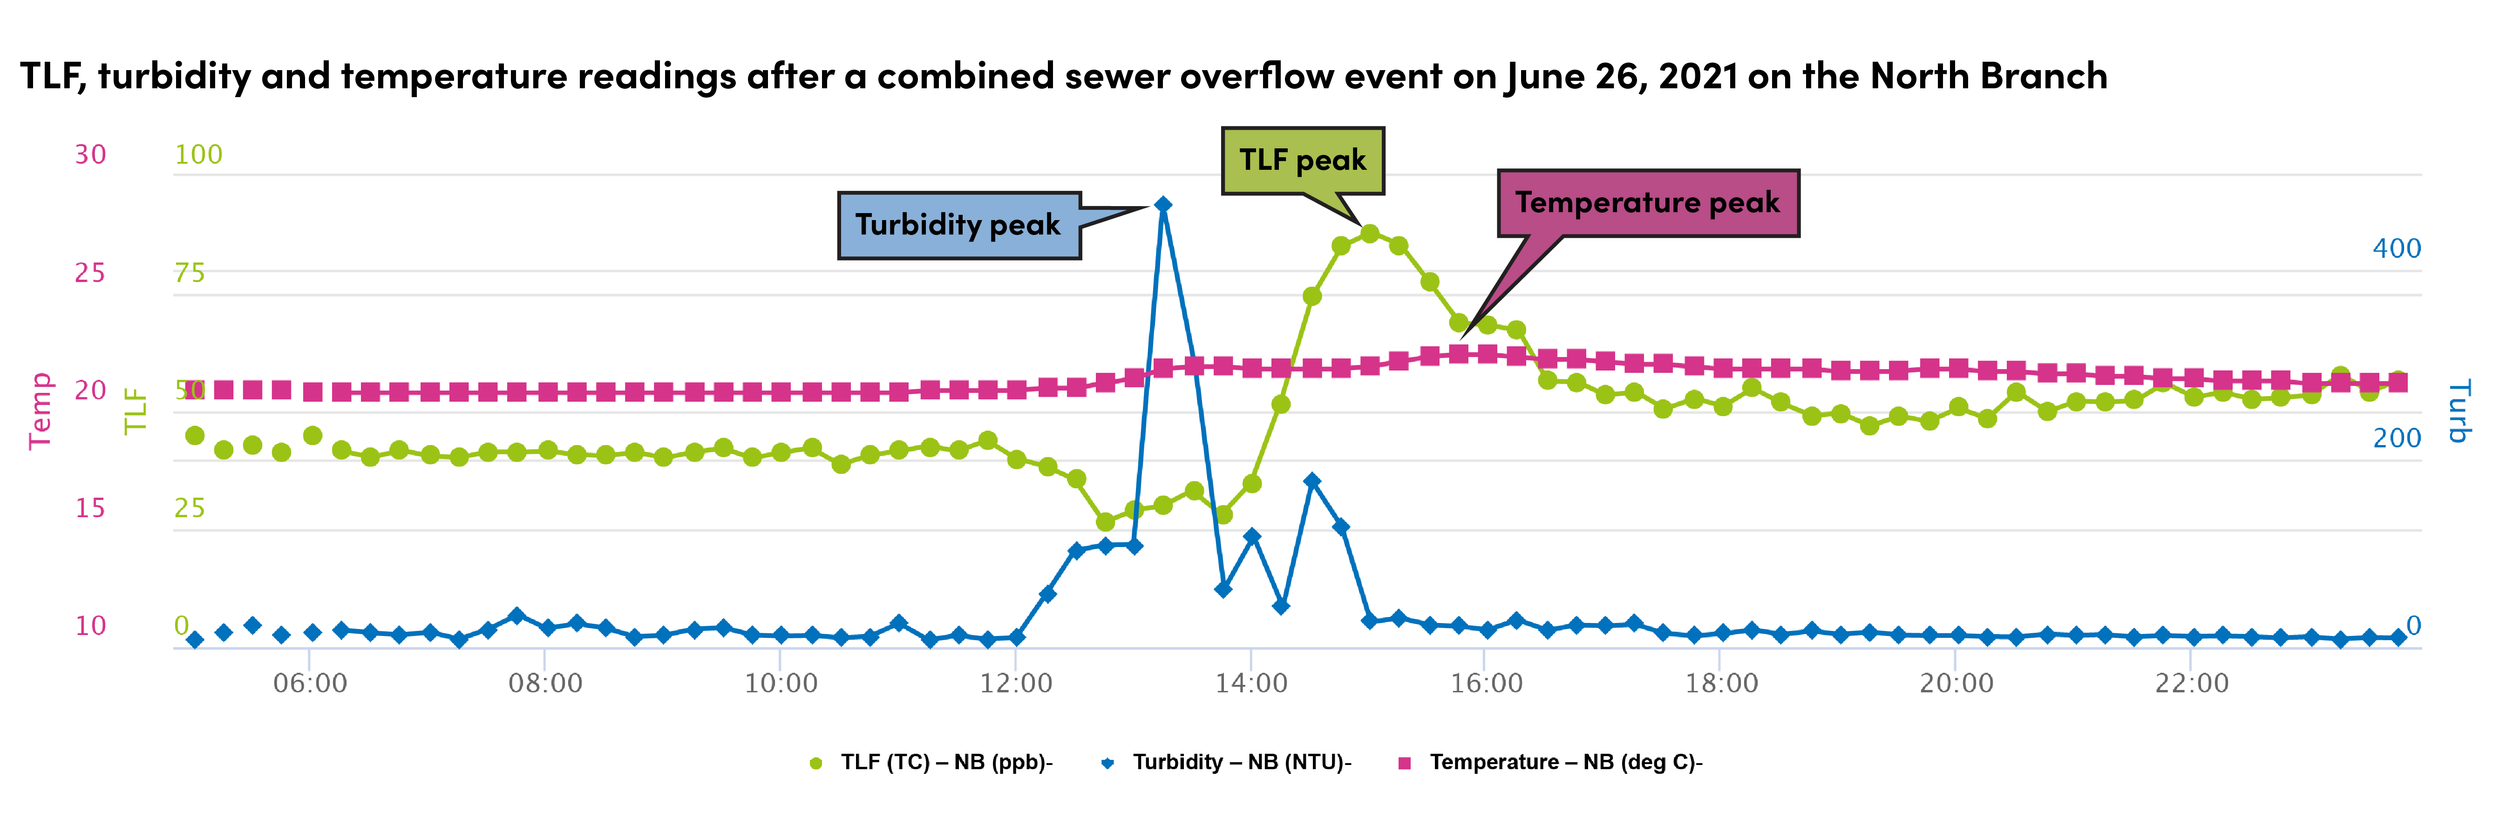
Plot 4: TLF, turbidity and temperature readings after a combined sewer overflow event on June 26, 2021, on the North Branch
What happens after Lake Michigan water flows into the river…
Lake Michigan water has a much lower background TLF, so when the lake water flow through the controlling gates on the North Shore Channel into the river suddenly increases, TLF readings on the North Branch drop. This is what we saw happen on May 6, 2021 (circled purple on Plot 2). Plot 5 below shows how other sensors responded to this occurrence: there was a slight temperature drop, because lake water is colder than river water, but no significant turbidity changes were observed. Data from a nearby monitoring station managed by the Metropolitan Water Reclamation District of Greater Chicago showed that there was a drop in specific conductivity at exactly the same time.
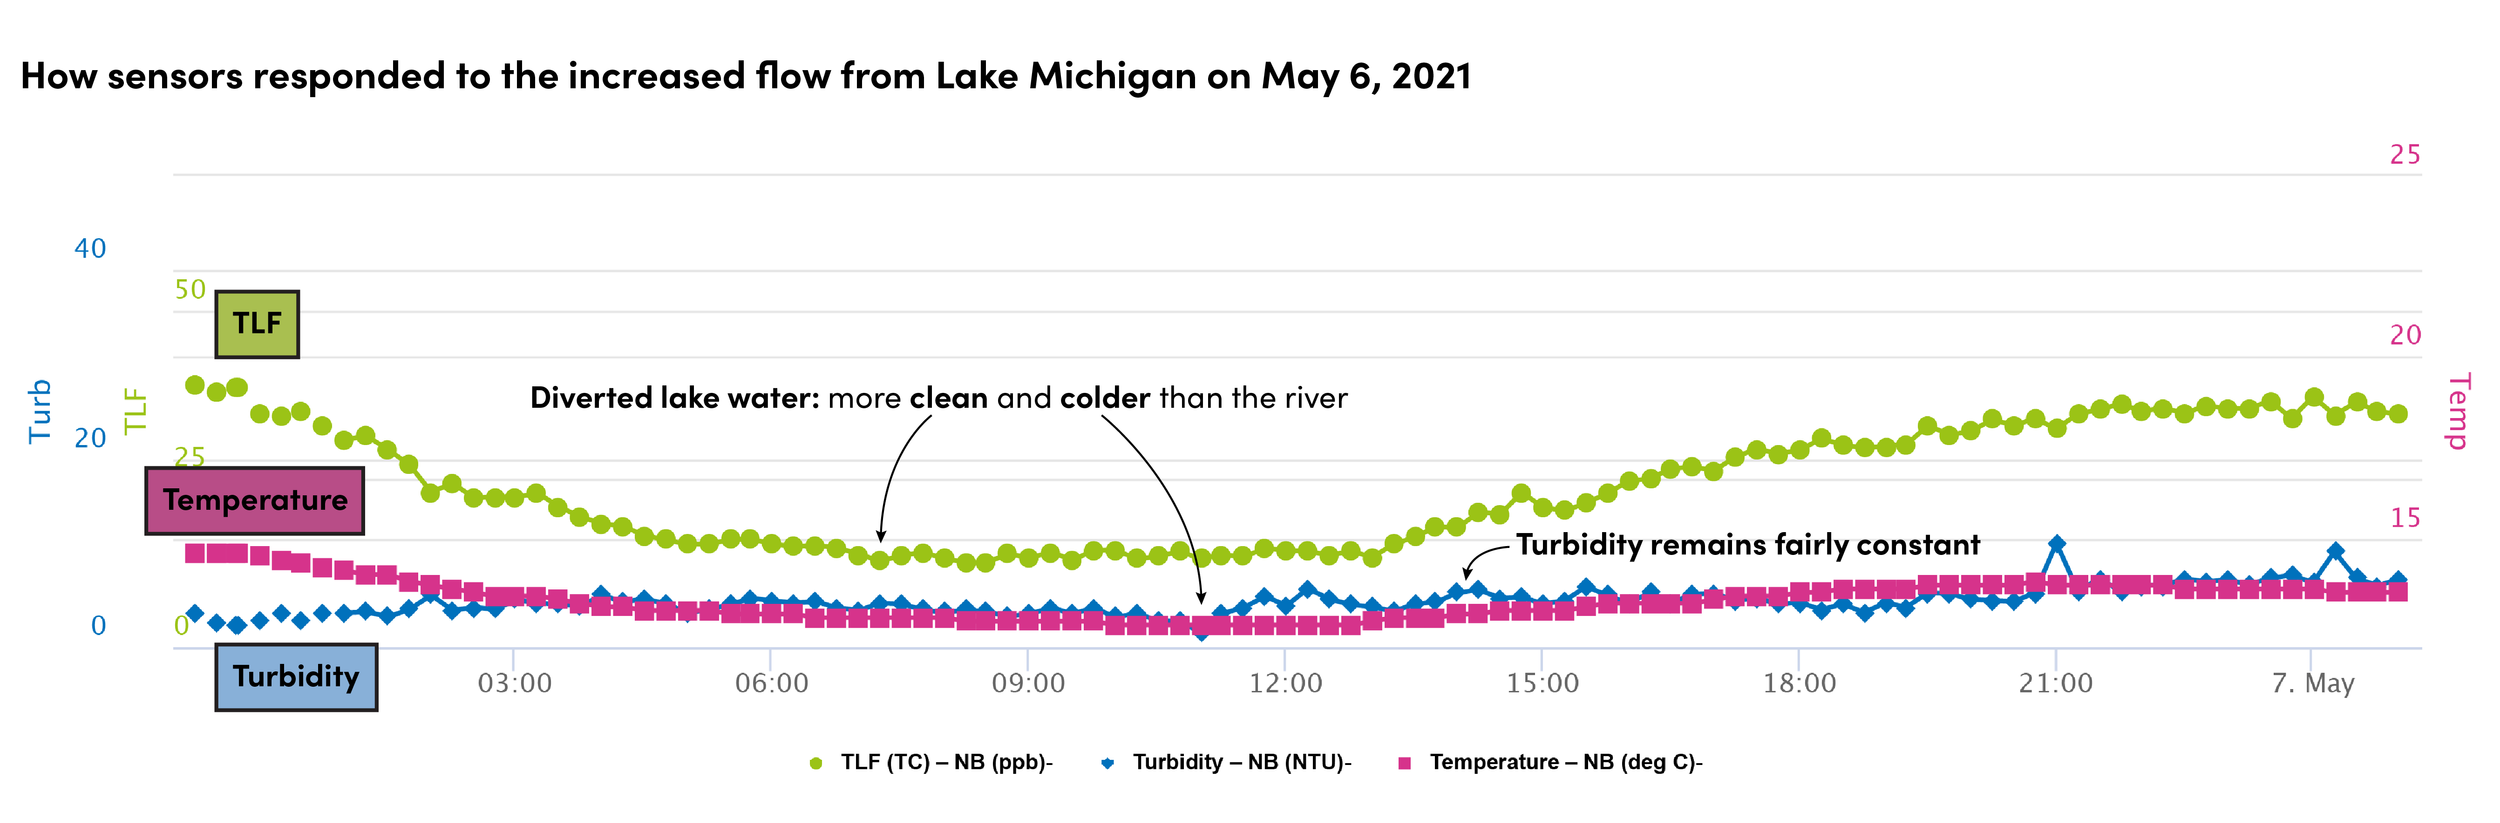
Plot 5: How sensors responded to the increased flow from Lake Michigan on May 6, 2021
New sensors in 2022
To improve our water quality assessment, we added two new sensors to each of the Proteus probes: colored dissolved organic matter (CDOM) and specific conductivity. CDOM is an optical sensor similar to TLF, but it has been shown to correspond better to natural organic matter rather than microbial concentrations. Some researchers are examining whether a combination of TLF and CDOM readings can provide more accurate estimates of microbial concentrations in natural waters compared to TLF alone, and this is the reason why we decided to add CDOM. Specific conductivity was added to mitigate the effects of dilution during heavy rain events and increased flow from Lake Michigan on the TLF readings.
We hope that sharing this real-time data through the H2NOW Chicago website will help people understand how water quality changes in the Chicago River and use this information to make decisions about how to spend recreational time on the river. We currently do not have a model that can confidently determine fecal coliform levels for all river conditions encountered during the recreational season, but we are working on it. Stay tuned!